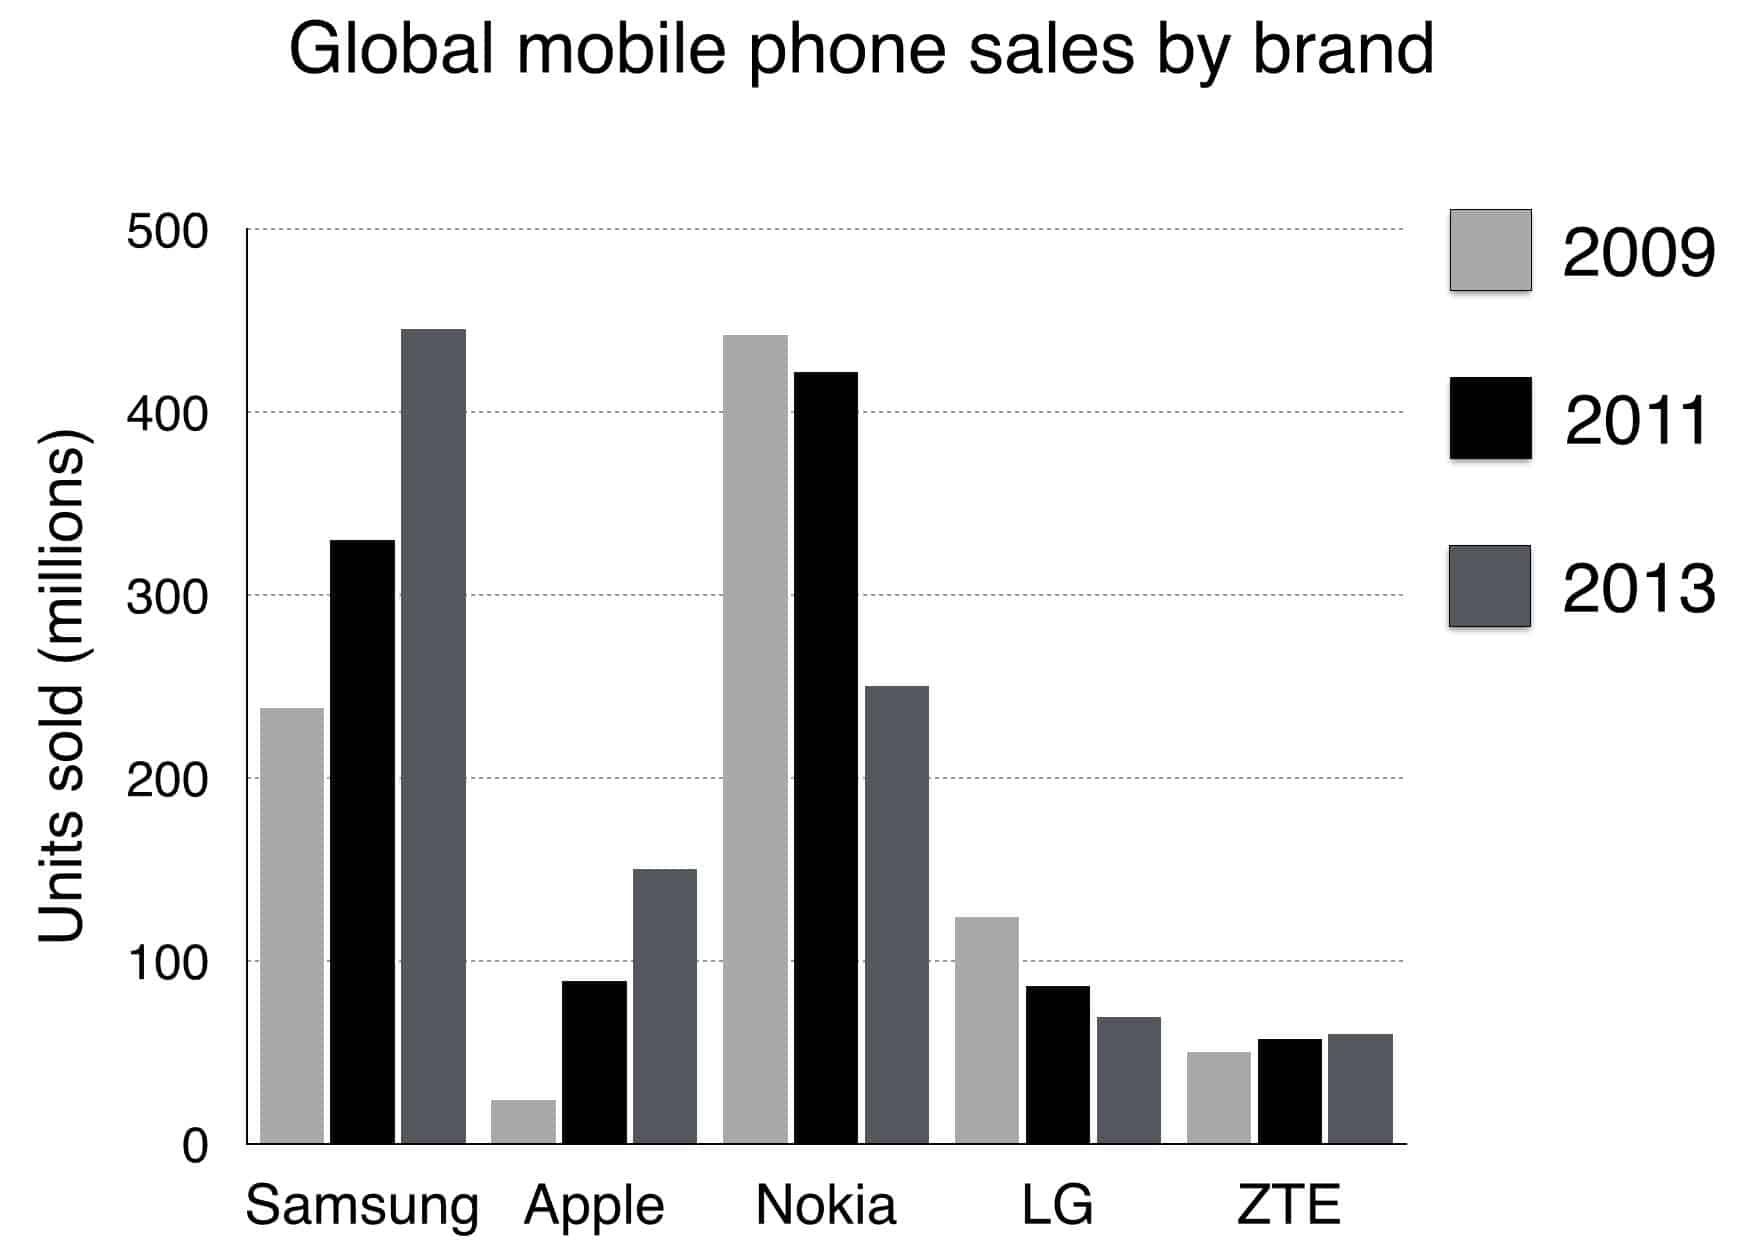
The chart shows global sales of the top five mobile phone brands between 2009 and 2013.
Summaries the information by selecting and reporting the main features, and make comparisons where revelant.
The bar chart compares the most popular cellphone manufacturing companies (Nokia, Samsung, LG, Apple, and ZTE) in terms of the phones they sold worldwide in the years 2009, 2011, and 2013. The units sold are measured in millions.
Overall, Nokia was the market leader in 2009 but was eventually overtaken by Samsung. LG also experienced a gradual decline in its sales numbers, but Apple and ZTE saw an increase, with varying degrees, in theirs.
Regarding Nokia and Samsung, the former sold nearly 450 million handsets in 2009, while the latter only managed to sell half that number. However, the sales figure for Samsung saw a significant rise of about 200 million units over the years and took the first place in 2013. By contrast, Nokia experienced a loss of similar number and reported its lowest figure in the third year.
In terms of the other three companies, the figure for LG was at around 120 million in 2009, after which it declined gradually to almost half that figure in 2013. Apple, on the other hand, was successful in increasing its sales figures from the lowest number on the graph, approximately 10 million in 2009, to about 150 million four years later. Finally, ZTE kept its share of the market at nearly 50 million with only an insignificant increase each year.


