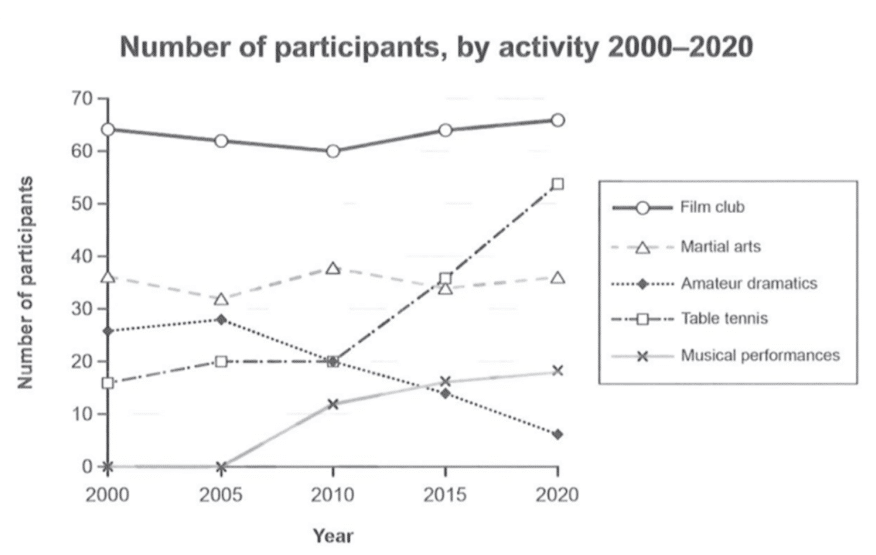
The graph below gives information on the numbers of participants for different activities at one social centre in Melbourne, Australia for the period 2000 to 2020.
Summarise the information by selection and reporting the main features, and make comparisons where relevant.
The line graph compares the participation numbers in five types of activities at a social center in Melbourne, Australia, from the year 2000 to 2020. The activities include film club, martial arts, amateur dramatics, table tennis, and musical performances.
Overall, the film club consistently remained the most popular activity, showing minimal changes throughout the period. In contrast, musical performances began gaining participants later and rose in popularity continuously. Table tennis and amateur dramatics exhibited opposite trends to one another, with the former gaining popularity. Meanwhile, the number of participants in martial arts fluctuated annually but showed little change in general.
Regarding the film club and musical performances, the former started with approximately 65 participants, experienced a slight decline to 60 over the next decade, and then returned to its initial level by 2020. The latter, on the other hand, had no participants until 2005, after which the numbers rose to just over 10 in five years and continued steadily to just under 20 by the end of the period.
As for the other activities, martial arts consistently attracted between 30 and 40 members. Table tennis, which maintained around 20 participants until 2010, experienced the most rapid growth, becoming the second most popular activity with nearly 55 participants by 2020. Conversely, amateur dramatics, initially attracting just under 30 members until 2005, saw a continuous decline and stood at the same level as martial arts in 2010. Over the subsequent years, it continued the trend and settled at about 5 participants by the final year.
Source of the task: Cambridge IELTS book number 19
Sample Written by: ESL Fluency


