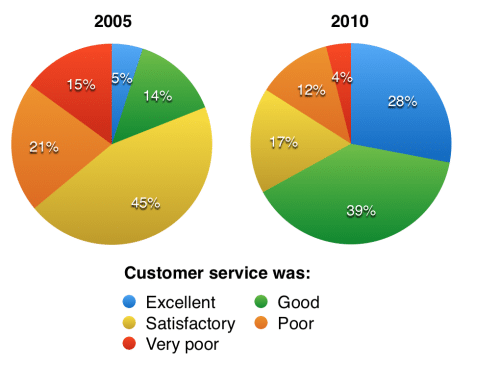
The charts show the results of a questionnaire that asked visitors to the Parkway Hotel how they rated the hotel’s customer service. The same questionnaire was given to 100 guests in the years 2005 and 2010.
Summaries the information by selecting and reporting the main features, and make comparisons where revelant.
The pie charts compare the results of a survey conducted at the Parkway Hotel in order to know the satisfaction levels of the guests about the hotel’s customer service in 2005 and 2010.
Overall, the customer service at the hotel experienced a significant improvement in the rating within this five-year period. While the majority of the guests rated their experience as poor or only satisfactory in 2005, most of the visitors in 2010 described it as good or excellent.
Regarding the positive responses, only a mere 5% of the visitors rated the customer service as excellent in 2005, while 14% thought it was good, and a little over two-fifths rated it as satisfactory. Five years later, the guests thought more positively about their stay in the hotel, so the corresponding figures for these responses stood at 28%, 39%, and 17% respectively.
In terms of negative responses, nearly a quarter of the guests in 2005 told that the service was poor, and 15% reported a very poor experience. However, in 2010, the hotel managed to lower the percentage of “poor” responses by 9% and “very poor” to an insignificant figure.

